MARB studies
Each MARB study is a self-contained experiment on the same task, the same authored part kit, and the same automated CADCLAW grader. Only the driver, or the short note we give it, changes. This page is the running log, so every result has one place to live.
A note on terms. Buildability metrics (did the model export a loadable STEP, and how many part instances did it place) describe what a model built. They are not the grade, which scores how correctly each part is located, oriented, and gapped against the answer key. Grading is a separate step. Studies that report buildability say so plainly.
| Study | Driver | Date | Runs | Headline | Status |
|---|---|---|---|---|---|
| Sighted local cells | qwen3-vl 32B + Nemotron 3 Nano Omni (vision, goal image in-loop) | 2026-06-12 | 15 | Seeing the goal made it worse: the sighted 32B places ~15 parts at 873 mm GAP vs the blind 80B text model's ~90 parts at 272 mm. Nemotron Omni: 0/5 exports. | Published |
| Fable 5 effort sweep | Claude Fable 5 (CadQuery) | 2026-06-11 | 4 | One model, four effort settings up to a multi-agent ultra run. Effort is not monotonic — but ultra cut GAP to 3.0 mm and set the board-best relative position. | Published |
| Local open-weight anchor | qwen3-coder-next (80B, on one local box) | 2026-05-30 | 30 | Recursive prompt study, now graded. One CAD command took buildability from 1 in 5 to 5 in 5, but the graded result is parts placed 100 to 400 mm off: grouped, not jointed. | Published |
| First results, frontier models | Claude (Fusion, CadQuery), OpenAI Codex (CadQuery) | 2026-05-26 | 3 | Each placed about 100 authored parts from one photo. Scores 12 to 15 out of 100. None buildable yet. | Published |
Study: the Claude Fable 5 effort sweep
A new frontier model arrived, and it exposes a knob the first results could not: reasoning effort. Same model, same task, same kit; only the effort setting changes. Does paying for more thinking buy a better machine?
| Effort | GAP median | ORIENT aligned | POS relative median | Wall-clock | Billed tokens |
|---|---|---|---|---|---|
| Ultra (multi-agent) | 3.0 mm | 47% | 30.4 mm | 83 min | 23.0M |
| Medium | 6.5 mm | 59% | 48.5 mm | 39 min | 4.7M |
| Low | 7.0 mm | 53% | 68.0 mm | 38 min | 4.2M |
| High | 7.0 mm | 49% | 38.1 mm | 45 min | 18.5M |
Token bills recovered post-run from the Claude Code session transcripts (per-message usage summed; the recovery script ships in the repo). High effort billed 3.9× medium for worse GAP and orientation — the non-monotonic curve has a price tag.
Within the single-agent sweep the answer is not monotonic. Medium effort beat both its cheaper and its more expensive siblings on interface gaps and orientation; high effort bought better relative position and nothing else; low drifted most on position. Turning the same knob further does not help.
Changing the harness does. The ultra run — the same model orchestrating subagents that probe every kit part, audit the v1 export adversarially (collision booleans, per-constraint arithmetic, visual fidelity against the reference images, BOM counts), then apply targeted fixes — cut GAP to 3.0 mm and set the best relative position on the entire board, 30.4 mm, ahead of every Opus and Codex run. The audit caught faults invisible at render scale: a motor shaft 4.9 mm short of its pinion, belts cutting 3.4 mm into an idler, a pulley installed hub-backwards. The price was roughly double the wall-clock and a 23.0M-token bill (~497K of it the audit subagents) — within 4% of what Opus CadQuery billed for its nine self-review attempts.
On the overall board, the Fable 5 runs slot between Claude Opus 4.7 and GPT-5 Codex on the primary GAP metric, with ultra at rank 3. The pattern echoes the local-anchor study below from the other end of the capability curve: undirected budget, whether turns for a local model or a reasoning-effort setting for a frontier one, does not convert into a better assembly — structured verification does. The full board lives on the benchmark page; single runs each, so treat the deltas as directional until we add seeds. The recap article pulls every finding to date together, including what we can and cannot say yet about token use.
Study: the sighted local cells
Every model so far built the machine from a text brief plus reference images it had to ask for. These cells hand a vision model the goal image directly, in-loop, on turn one. The obvious hypothesis: seeing the target helps. It does not.
| Cell | Buildable | Parts placed (median) | GAP median | ORIENT | POS rel. |
|---|---|---|---|---|---|
| Blind text 80B (qwen3-coder-next, best cohort, n=9) | 9/10 | ~62 | 272 ± 149 mm | 12% | 118 ± 47 mm |
| Sighted 32B (qwen3-vl, 8 turns, n=5) | 5/5 | 12–17 | 873 ± 174 mm | 0% | 1005 ± 613 mm |
| Sighted 32B, 12 turns (n=2, preliminary) | 2/2 graded | 16–20 | 335 ± 138 mm | 5% | 260 ± 249 mm |
| Sighted Nemotron 3 Nano Omni (n=5) | 0/5 | — | — | — | — |
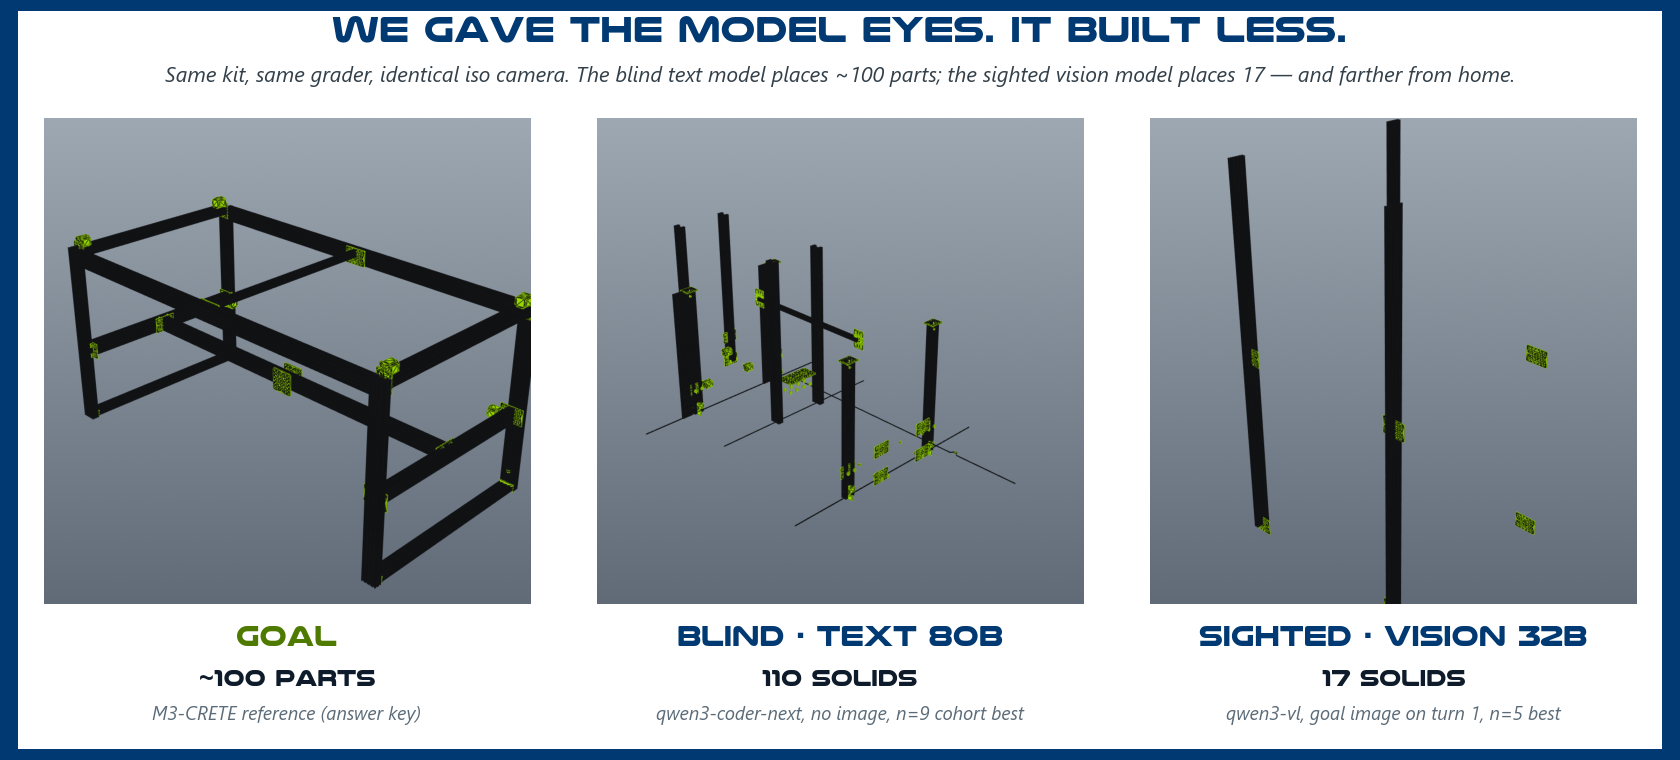
- Seeing the goal made the build smaller, not better. The sighted 32B exports reliably (5/5) but places only 12–17 parts against a ~101-part target — about a sixth of what the blind 80B text model places — and what it does place sits farther from home on every metric. At this model scale, image tokens appear to crowd out the context and turns that geometry needs.
- More turns buy accuracy, not coverage. The 12-turn variant (preliminary, two clean seeds — three were lost to a host-side timeout bug we have since fixed and documented) improved GAP from 873 to ~335 mm but still placed under 20 parts. The bottleneck is not time; it is what the model does with the image.
- The reasoning vision model never closed the loop. Nemotron 3 Nano Omni ran full 8-turn sessions with real tool use (57–219K tokens per run) and produced zero loadable exports in five attempts. Reported as 0/5 buildable — a result, not an absence.
- Caveat, stated plainly: this compares a 32B vision model against an 80B text model — different sizes — because those are the strongest local options per modality. The cell answers a shop's question ("does my best local vision model beat my best local text model here?"), not a controlled ablation. A same-model image-on/off ablation needs a frontier vision model and is queued.
Study: the local open-weight anchor
The cloud models in the first results are large and expensive. This study asks the honest floor question: how does a strong coding model that a small shop could own and run for free, on one machine, do on the same task. And once it is running, what short note actually helps it.
We ran it thirty times and changed only the brief operational note before each batch of five. Every note stayed inside the fairness wall: it clarified the CAD tool or the task, and never revealed the reference design.
| Cohort | Note given | Turn budget | Buildable file | Parts placed (median) |
|---|---|---|---|---|
| A | None (control) | 8 | 1 of 5 | 15 |
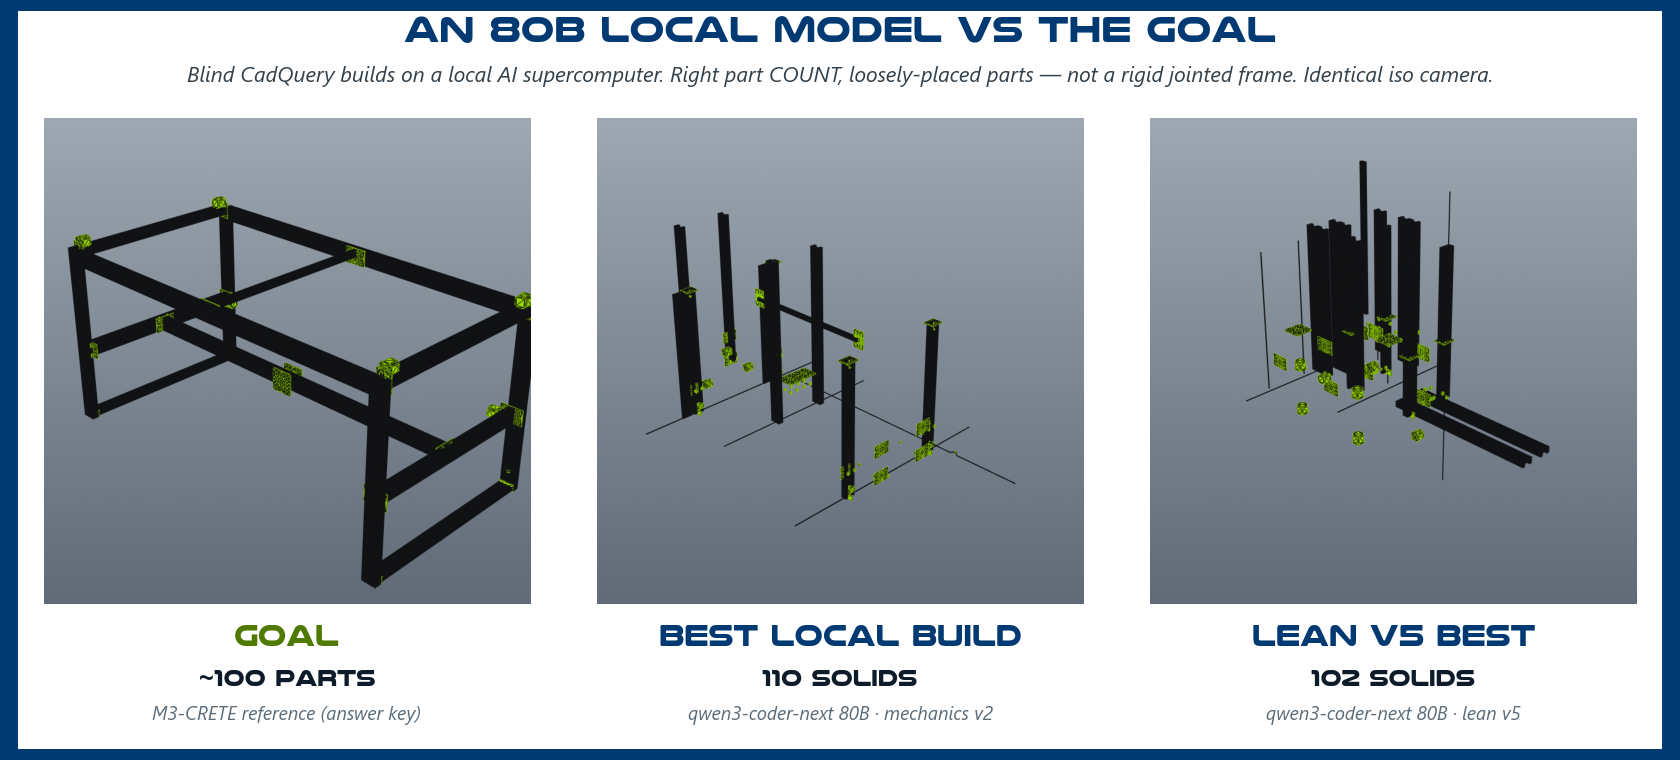
| B | Correct CAD export idiom | 8 | 5 of 5 | 98 |
| C | B, plus a build-volume clarification | 8 | 3 of 5 | 28 |
| D | B, plus design-goal requests | 8 | 2 of 5 | 24 |
| E | Same as D | 14 | 4 of 5 | 30 |
| F | Lean note, the export idiom sharpened | 8 | 5 of 5 | 84 |
Target is about 100 placed part instances. The kit holds authored STEP parts; the model places each one and exports a single STEP file.
What the recursion taught us
- One tool step gated everything. With no help, four of five runs wrote sensible placement code, then failed on the final export by handing an assembly object to a function that needs a solid. Two lines naming the correct export call flipped the result from 1 of 5 to 5 of 5.
- More guidance made it worse. Adding a build-volume note, then requests to consider rigidity and manufacturability, lowered buildability each time. A small model on a short budget spends its turns reading and reasoning instead of building.
- More time helped less than expected. Raising the budget recovered the export rate but not the part count or the design quality. The extra time went to a tool-confusion loop, not to better engineering.
- Lean and exact won. The best note named only the failure modes the model actually hit, and dropped everything else. It matched the best buildability and removed the worst failure loop.
The grades: placed, not jointed
Updated 2026-06-12 with five extension seeds per cohort: the original "5 of 5 buildable" did not survive more seeds — combined buildability is 9/10 (mechanics v2) and 8/10 (lean v5), and the spreads widened. That is what seeds are for; single-cohort rates flatter. The graded aggregates below use all loadable seeds.
The two cohorts that export reliably have now been graded with the same GAP, POS, and ORIENT rubric as the frontier track, so the numbers are directly comparable. Read them with the buildability table above: the model places roughly the right number of parts at roughly the right scale, and the grades quantify how far those parts sit from a machine.
| Cohort (n = 5) | GAP median | ORIENT aligned | POS relative median |
|---|---|---|---|
| Mechanics v2 (n=9 of 10) | 272 ± 149 mm | 12% | 118 ± 47 mm |
| Lean v5 (n=8 of 10) | 341 ± 133 mm | 20% | 233 ± 139 mm |
| Frontier range, for scale | 0.0 to 7.8 mm | 47 to 69% | 38 to 68 mm |
- Parts land 100 to 400 mm off on a 2000 mm machine. Joints that should sit flush are 300 to 400 mm apart at the median, and only 11 to 14% of interfaces fall within 1 mm. About 30% of asymmetric parts get the correct rotation.
- The shape is closer than the anchor. Relative position error is far smaller than absolute (104 mm vs roughly 500 mm for mechanics v2): the model captures local clustering better than it anchors the whole frame.
- Buildability and accuracy are different objectives. Lean v5 exports cleanest; mechanics v2 places parts more accurately. Tuning a local agent only on whether it builds optimizes the wrong thing.
- The structural gates agree. Both graded builds fail inventory on the part mix (not the count) and show 20 to 28 pairs of clipping solids, while nothing floats free. Parts grouped together, not a connected frame; a connectivity gate that scores seated joints is the next grader level.
What this study does not yet answer
- Design judgement at scale. Asking a small model to weigh manufacturability, thermal load, vibration, fatigue, and kinematics is the real goal of the benchmark. It pays off only with a larger model, a longer budget, and a grader that can score those modes. That work belongs in the shared task definition, not in a local note.
Method, harness, grades, and the full run catalogue are in the open-source repository. Correctness grading uses the same CADCLAW gates as every other MARB run.